- Home
- Best of Brands

With a boom in online retail, an estimated 75,000 brick-and-mortar retail stores could close by 2026. In 2019, the process had already started for some brands including Gap, Things Remembered, Starbucks, and Target.
Of course, out with the old typically means in with the new, so for physical retail chains looking to survive and even thrive during this major shift in consumerism, they may want to invest in brand loyalty because it's more important than ever.
And this means creating a genuine connection with customers. Studies suggest that while "values and perks" will only be attractive for a short time, transparent communication and an emotional connection (including feelings of love) can help cultivate a long-term relationship.
So which brands have people talking for better or worse, and which brands may be forgotten in the future? We examined Google search trends between April of 2018 and April of 2019 to determine which brands achieved peak relevance in some epic showdowns – Coke versus Pepsi, Spotify versus Pandora, DC versus Marvel, Fox News versus CNN, and Apple versus Microsoft – and surveyed 1,000 people about brand loyalty. Keep reading to see our results.
AUTOMOTIVE RIVALRIES
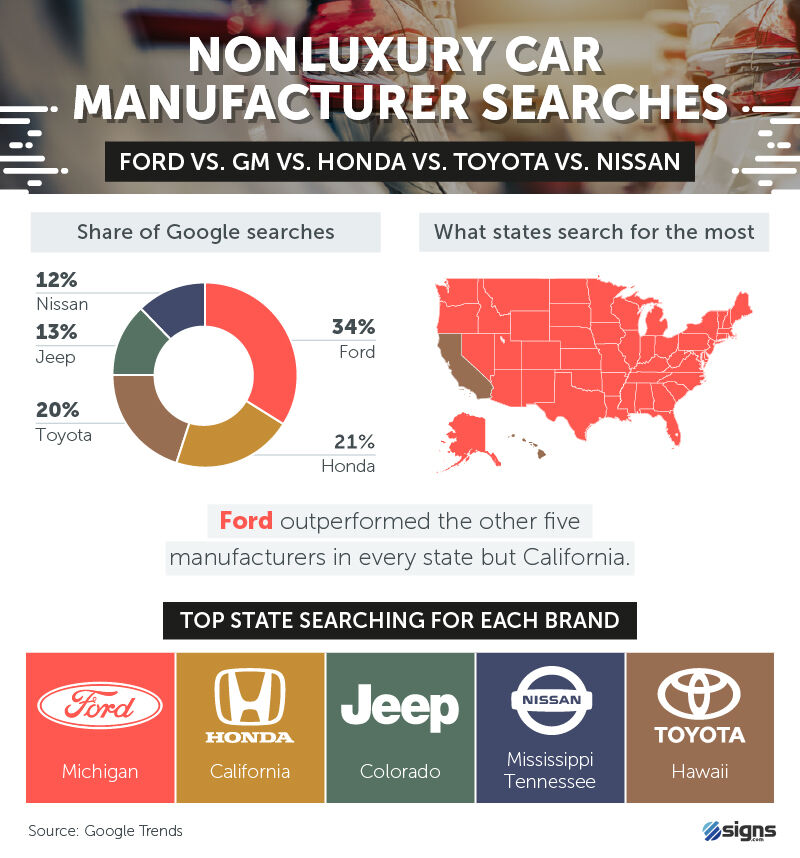
In 2018, Americans purchased over 17 million vehicles – 68% of which were pickup trucks and SUVs. Not only was Ford America's most-purchased vehicle, but it was also the top search for nonluxury manufacturers. In May 2019, Ford announced it would eliminate 7,000 white-collar jobs across the company, leaving many analysts to wonder what will come next for the auto giant.
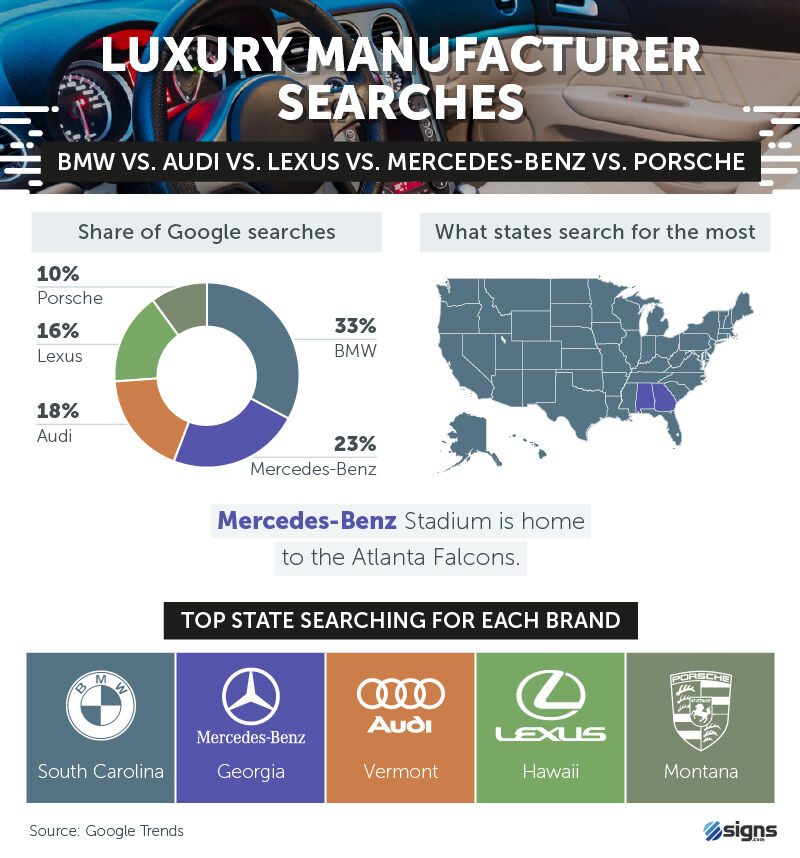
In 2018, the cost for purchasing a new vehicle hit record highs across the country, cresting above an average price not seen since 2008 –or ever before. Among people searching for luxury vehicles between April of 2018 and April of 2019, BMW accounted for 33% of queries (the highest volume in every state except Georgia and Alabama). Among the 10 best-selling luxury cars in 2018, BMW accounted for three: the 4 Series (seventh place), 5 Series (sixth place), and 3 Series (second place).
The price of purchasing a new car is going up (not to mention necessary maintenance and insurance coverage), but at the same time, so is the popularity of ride-hailing services. After all, why go out of your way to purchase a vehicle (which depreciates moments after you drive off the sales lot), when you can rely on a cheaper alternative?
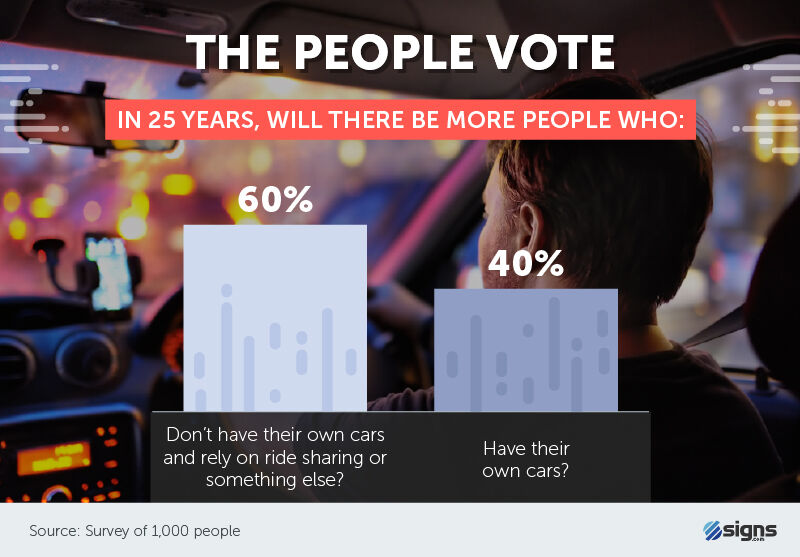
On average, it costs Americans over $9,000 to own and maintain a car every year, but ride-hailing and -sharing services are typically less expensive for low-mileage commuters. According to our survey, 60% of respondents believed more people would rely on alternative methods of transportation than own a vehicle (40%) in the next 25 years.
ENTERTAINMENT AND STREAMING RIVALRIES
 Monthly
streaming services may be an inexpensive way to access huge libraries of music. However, for
companies like Apple Music and Spotify, music-streaming platforms represent a tremendous loss of revenue, as the
competition between platforms remains fierce. While Apple Music had 50 million active users
for the first time in 2018, Spotify boasted 83 million subscribers around the same time.
Monthly
streaming services may be an inexpensive way to access huge libraries of music. However, for
companies like Apple Music and Spotify, music-streaming platforms represent a tremendous loss of revenue, as the
competition between platforms remains fierce. While Apple Music had 50 million active users
for the first time in 2018, Spotify boasted 83 million subscribers around the same time.
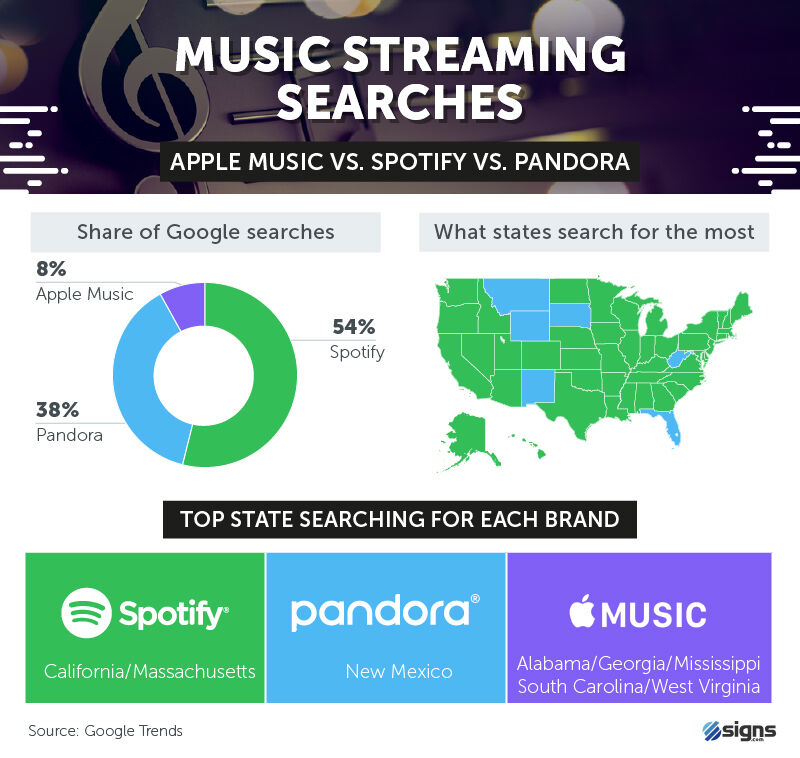
According to Google Trends, 54% of people searched Spotify, followed by Pandora (38%) and Apple Music (8%). Pandora was the leading music subscription service in six states, including, Mississippi, New Mexico, and West Virginia.
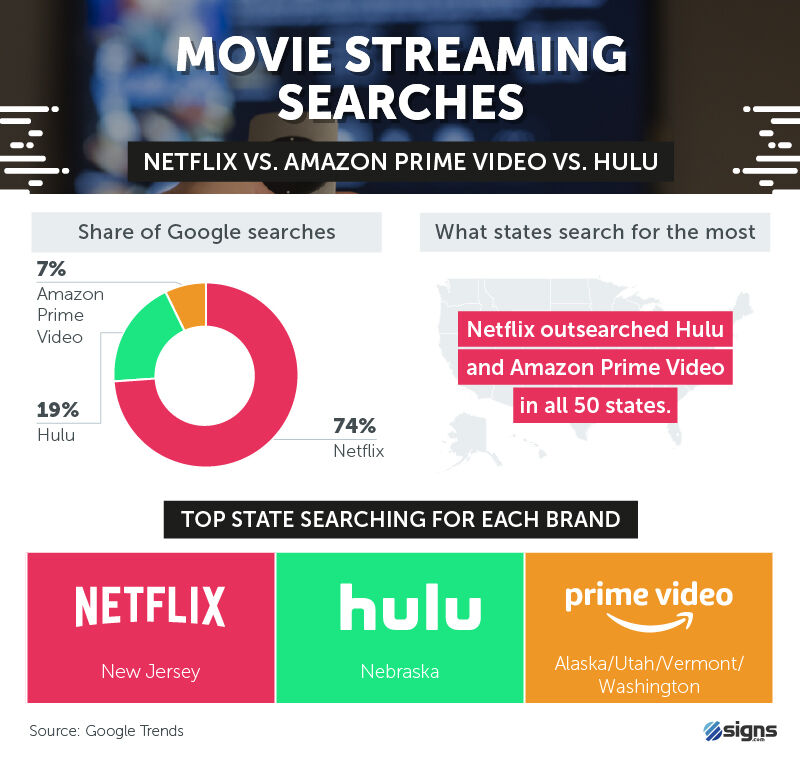
Disney+ is launching in 2019, every episode in season 8 of "Game of Thrones" cost HBO $15 million to make, and Amazon's new "Lord of the Rings" series was estimated to cost $500 million by some calculations. Despite these efforts from competitive media companies, Netflix is still heralded as a leader of streaming based on its active subscriber count, exclusive content, and viewership.
Google searches help solidify Netflix's claim to the throne. While Amazon Prime Video managed to eclipse 7% of Google searches, Netflix-related inquiries accounted for 74% of total searches.
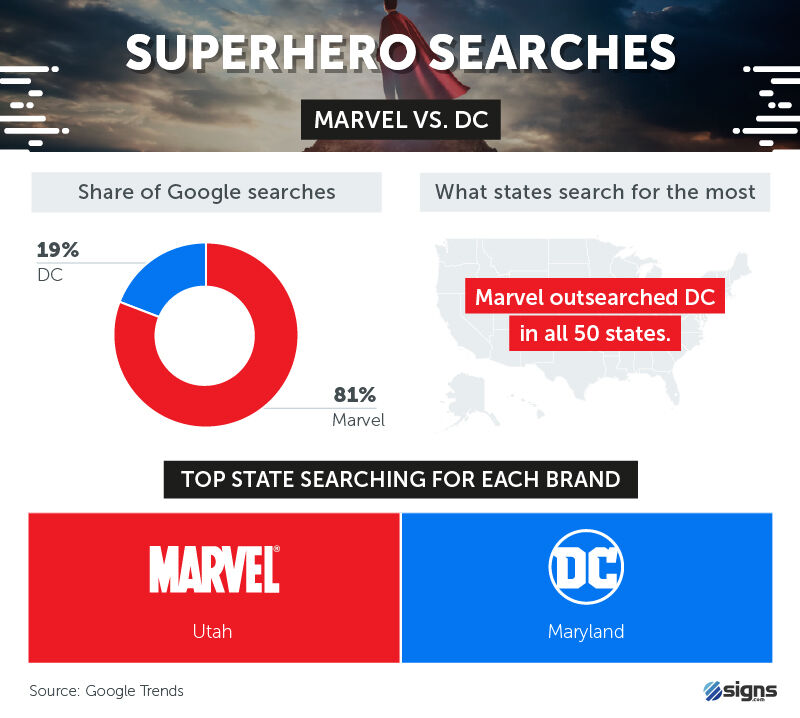 Beginning with "Iron
Man" in 2008 and ending (at the time of this writing) with "Avengers: Endgame" in 2019, the
22 movies of the Marvel Cinematic Universe have grossed over $21 billion worldwide. Perhaps fueled
by their big-screen success, 81% of Google superhero searches featured Marvel (most
searched for in Utah), while 19% went to DC Comics (most searched for in Maryland).
Beginning with "Iron
Man" in 2008 and ending (at the time of this writing) with "Avengers: Endgame" in 2019, the
22 movies of the Marvel Cinematic Universe have grossed over $21 billion worldwide. Perhaps fueled
by their big-screen success, 81% of Google superhero searches featured Marvel (most
searched for in Utah), while 19% went to DC Comics (most searched for in Maryland).
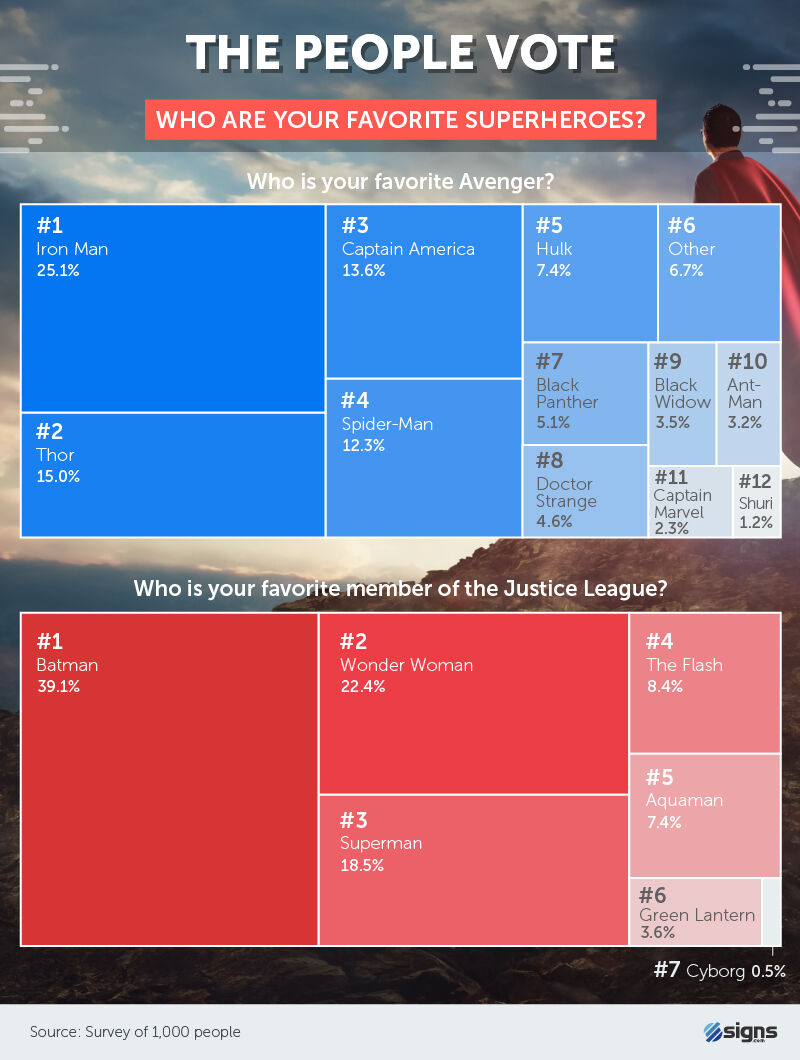
As a brand, Marvel may have the popular vote on lock. But as far as individual heroes are concerned, one vigilante caped crusader isn't going down without a fight. We asked people who their favorite characters from both universes is.
While Iron Man (25%), Thor (15%) and Captain America (14%) accounted for the most votes, Batman outperformed all three among DC characters, accounting for more than 39% of the votes. It's no wonder fans get so passionate about Batman's big-screen casting choices.
NEWS RIVALRIES
With so much discussion surrounding the spreading of inaccurate and misleading headlines and stories, the technology behind fake news only seems to be getting more sophisticated.
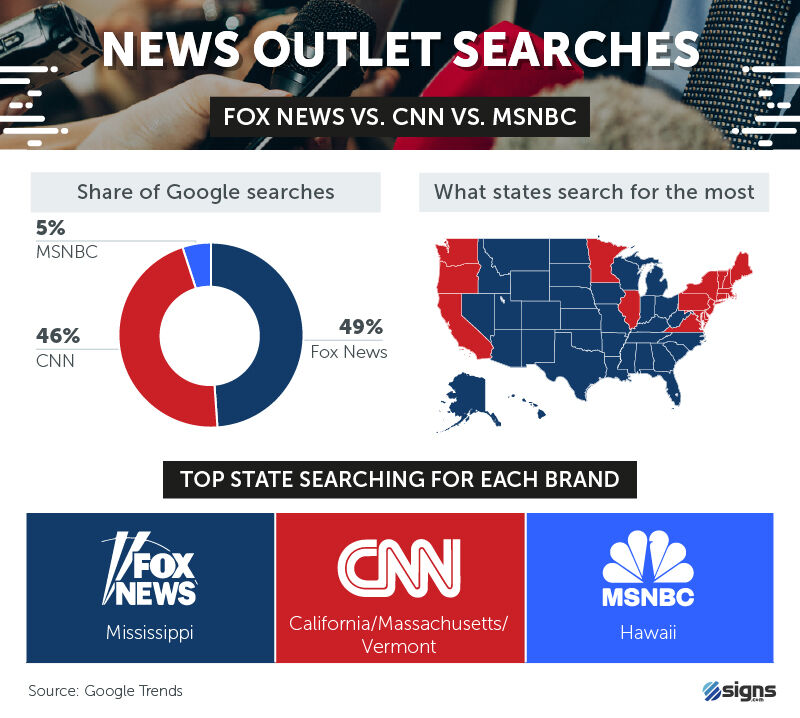
Between April of 2018 and April of 2019, Americans were largely split on their search history for major news outlets. While 49% of people searched for Fox News and 46% searched for CNN, just 5% were interested in MSNBC. CNN was the top search in three states – California, Massachusetts, and Vermont – while Fox News was most heavily searched for in Mississippi.
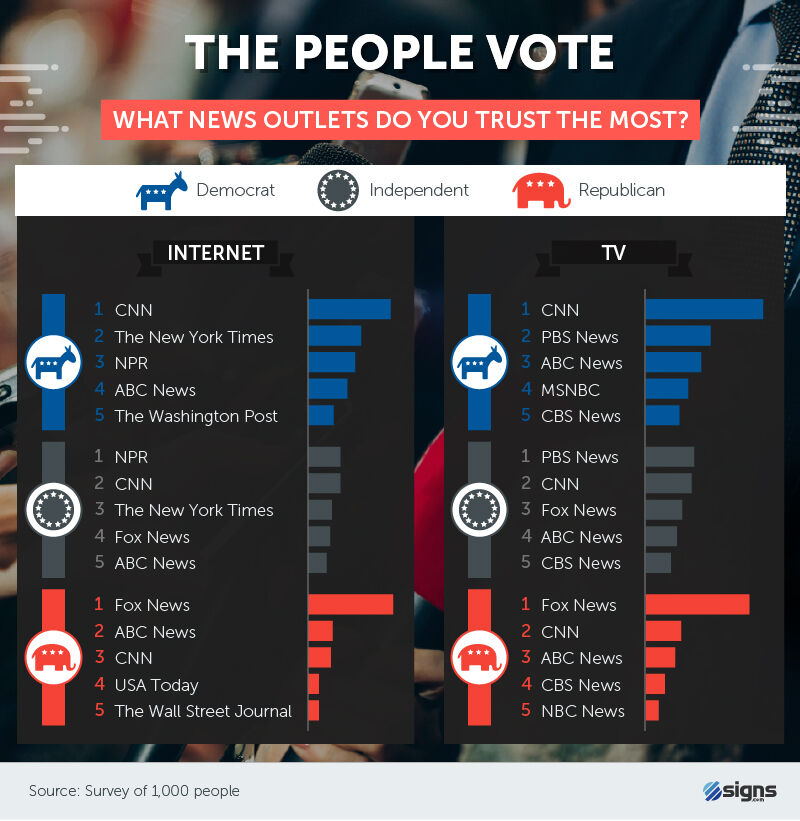
The proliferation of fake news may contribute, in large part, to people's distrust toward mainstream media outlets, but respondents even struggled to agree on which networks were the most trustworthy overall.
While people who identified as Democrats ranked CNN and The New York Times among their most trusted online news sources, Republicans were more inclined toward Fox News and ABC. In contrast, when asked about TV, both Democrats and Republicans ranked CNN among their most trusted outlets (bested only by Fox News among more conservative respondents).
FINANCIAL RIVALRIES
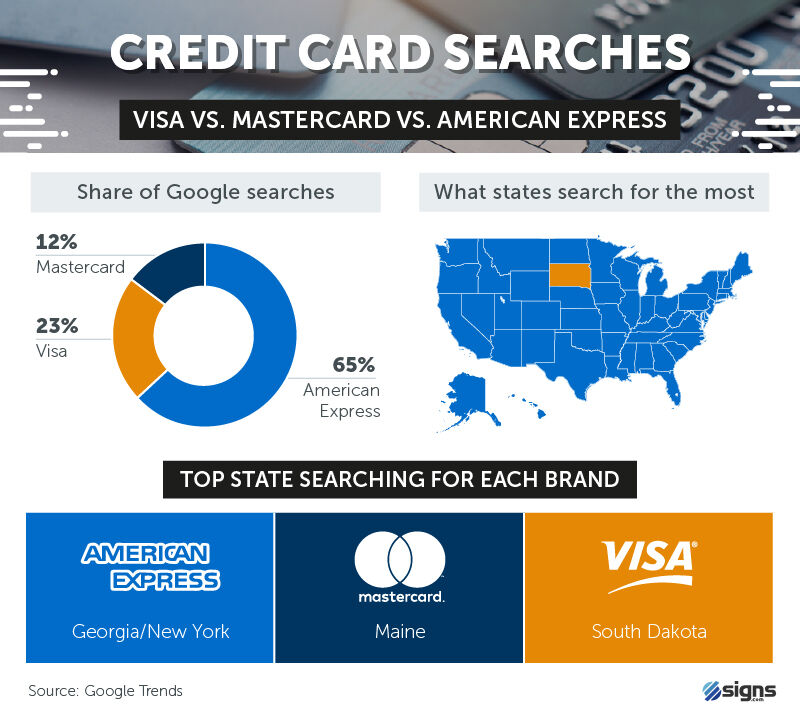
With just a little bit of financial savvy, credit card points can be their own form of currency, funding flights, hotels, and even random purchases. When it came to credit card searches, American Express accounted for 65% of all queries. With American Express searches being highest in New York and Georgia, Visa (23% of searches) was highest in South Dakota and Mastercard (12%) was highest in Maine. And, while American Express trails Visa and Mastercard in overall transactions, it is the only one among the three that is a card issuer, which accounts for it being more likely to be searched for by consumers.
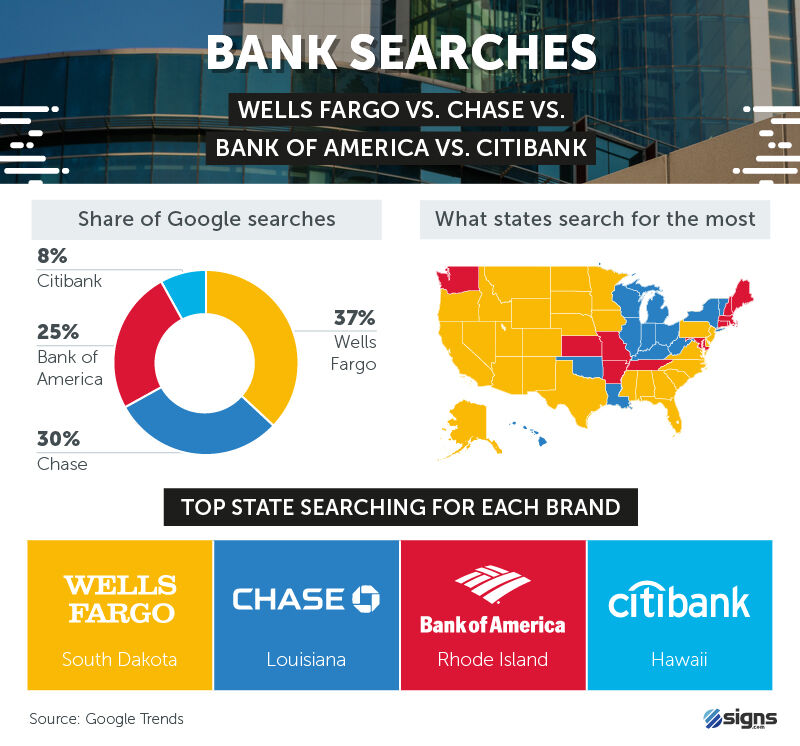 When it came to cold,
hard cash, Wells Fargo earned the top spot as the top search among the fourmost popular
branches. Wells Fargo accounted for 37% of all searches (most popular in South Dakota),
followed by Chase (30%), Bank of America (25%), and Citibank (8%).
When it came to cold,
hard cash, Wells Fargo earned the top spot as the top search among the fourmost popular
branches. Wells Fargo accounted for 37% of all searches (most popular in South Dakota),
followed by Chase (30%), Bank of America (25%), and Citibank (8%).
FOOD RIVALRIES
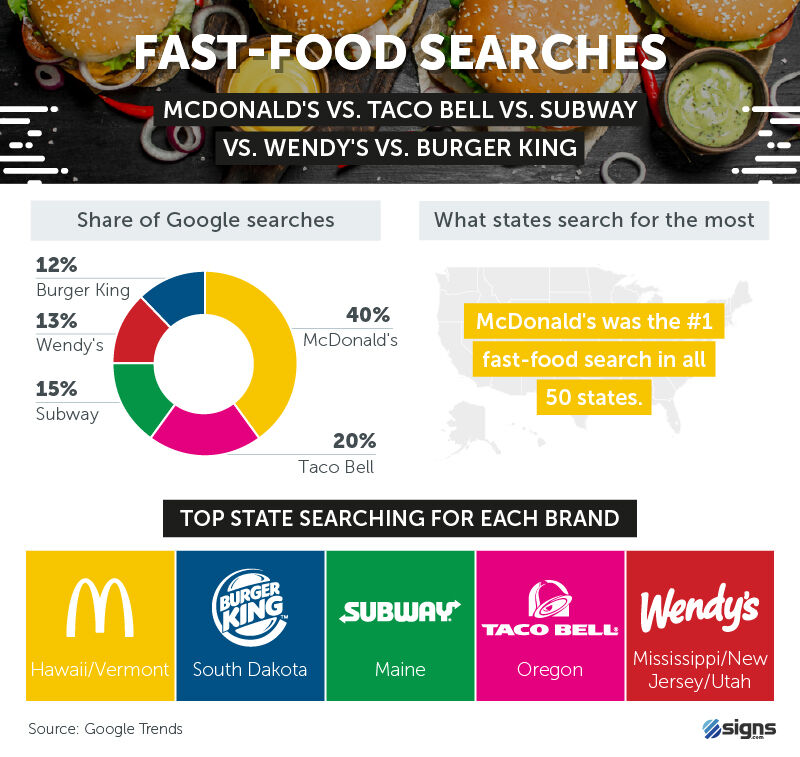
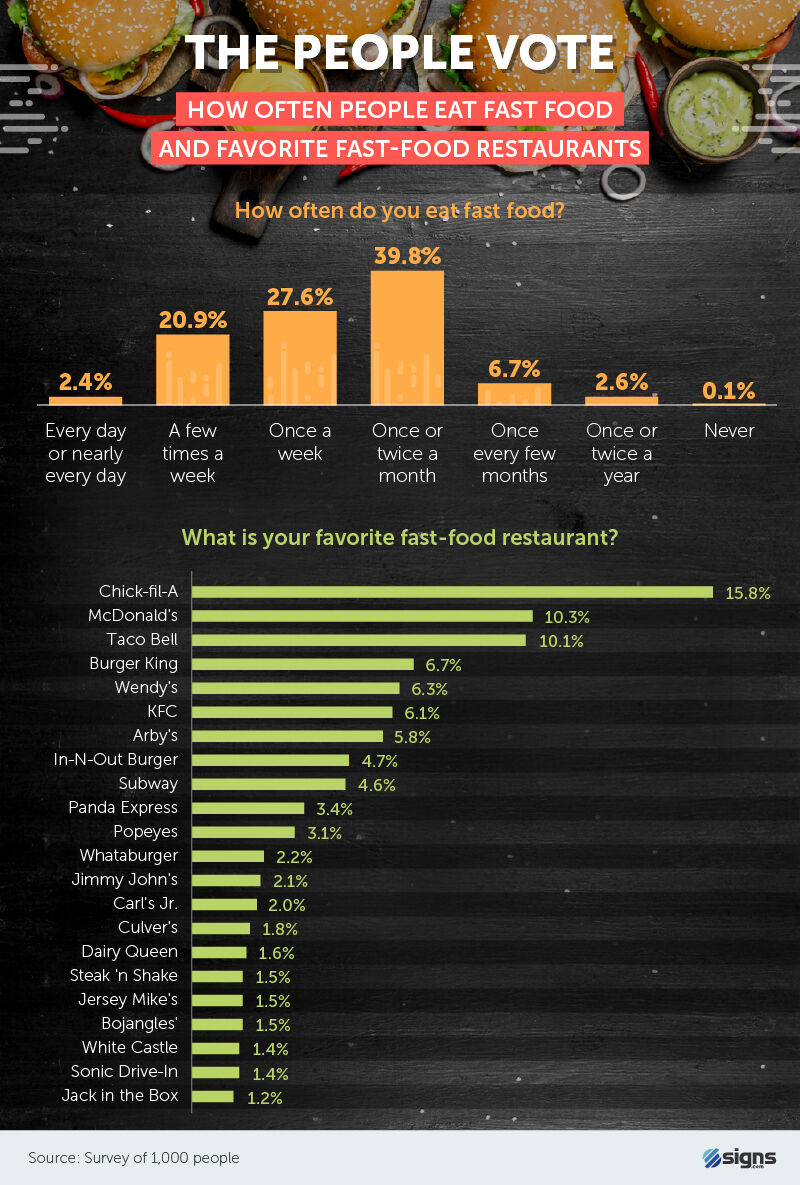
On any given day, roughly 40% of the U.S. population consumes fast food. While readily available and ultra convenient, studies suggest fast food is actually more popular among higher-income segments of the population. It may not be an indication of the perfect burger and fries, but McDonald's earned 40% of Google searches, followed by Taco Bell (20%), Subway (15%), Wendy's (13%), and Burger King (12%).
For burger and chicken sandwich enthusiasts, is it the entree or side course that creates a bias toward major fast-food chains? While no two patties will ever taste the same, some fast-food connoisseurs have big opinions on the standard side of fries. From waffle-cut to curly fries and the nacho variety, there's a wide spectrum to choose from.
When asked about their favorite fast-food establishments, three eateries reigned supreme: Chick-fil-A (16%), McDonald's (10%), and Taco Bell (10%). When asked about their own eating habits, 40% of respondents admitted to eating fast food once or twice a month, while nearly 28% ate it weekly, and more than 1 in 5 ate it multiple times during the week.
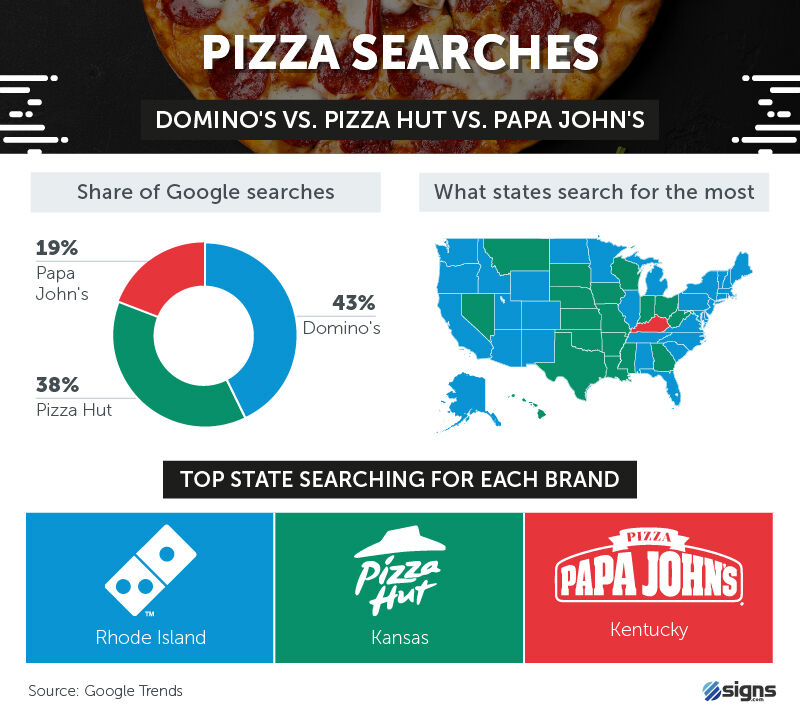
There may be very few universally accepted truths – some people believe the world is flat in 2019 – but the popularity of pizza is probably one of them. Considered America's "national food" by some, 43% of pizza searches were for Domino's, followed by Pizza Hut (38%) and Papa John's (19%).
There's no denying Americans love pizza, but when it comes to how it should be served, they're sometimes much less in agreement. With so many different preparations and styles to choose from – thick crust, thin crust, baked, wood oven, sauce preferences, and toppings – there may be no perfect pizza.
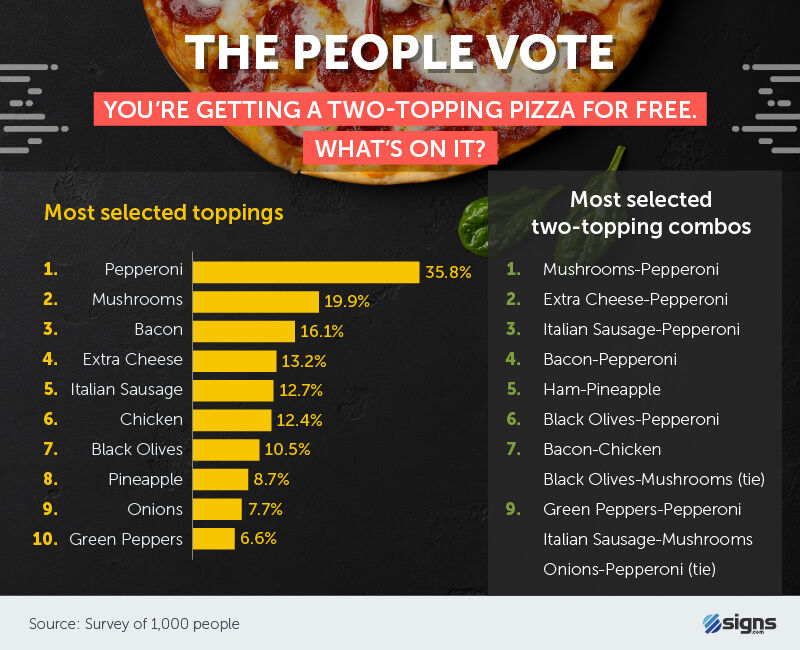
Still, if they could have any two toppings at no additional cost on their favorite pizza, respondents would choose pepperoni (36%) and mushrooms (20%). Like peanut butter and jelly or cheese and tomato sauce, some combinations just work. Among the most selected two-topping combos were mushrooms and pepperoni, extra cheese and pepperoni, and Italian sausage and pepperoni. No matter how you slice it, most people like pepperoni on their pies.
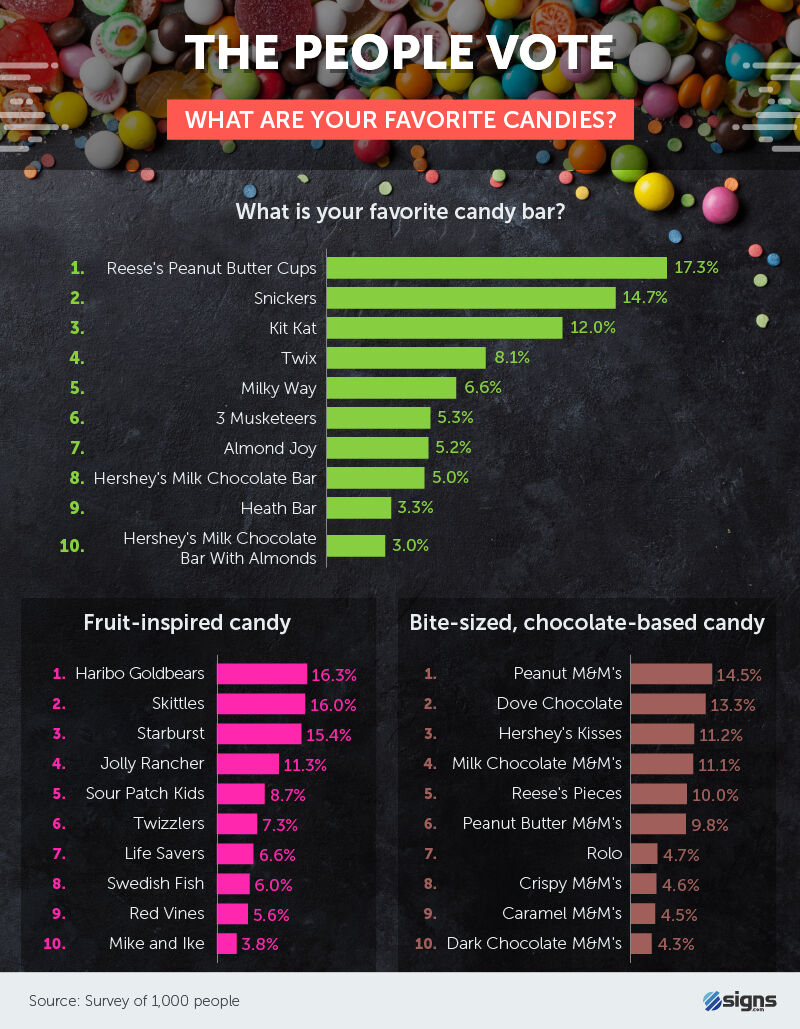
For Halloween 2018, candy sales in the U.S. were expected to reach as high as $9 billion. Despite potentially encouraging kids (and probably a few adults) to eat far more than the recommended dose of sugar in a single sitting, it may be hard to resist the sweet (and sometimes salty) draw of your candy faves.
Reese's Peanut Butter Cups (17%) ranked as the leading selection for people's favorite candy bar, followed by Snickers (15%), KIT KAT (12%), and Twix (8%). Of course, chocolate isn't the only solution for getting your sugar fix. Among fruit-inspired candy, HARIBO Goldbears and Skittles nearly tied as fan favorites, earning roughly 16% of the vote each.
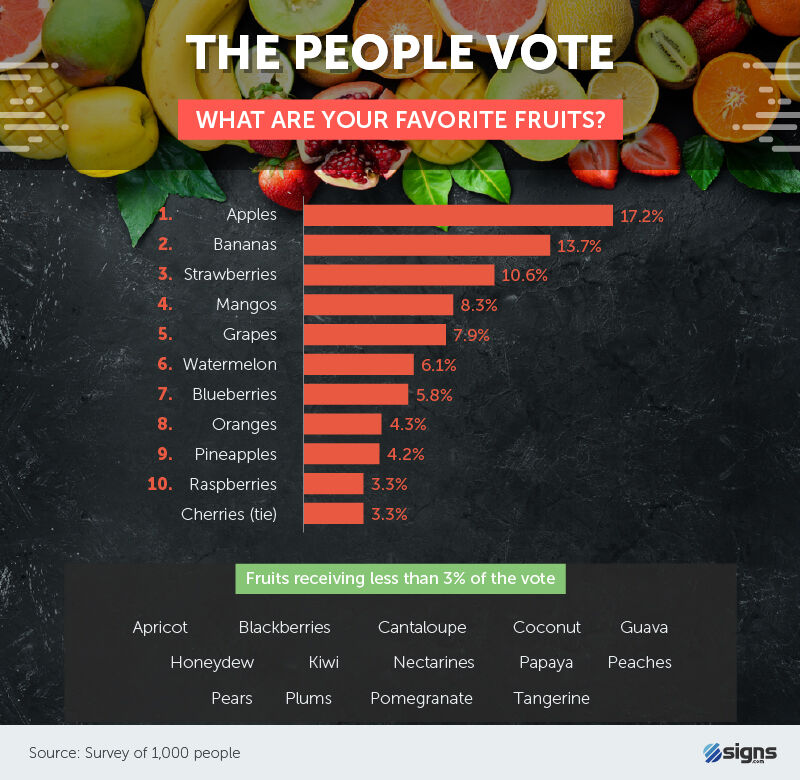
Just because something tastes sweet doesn't mean it's inherently bad for you. As long as we're talking about naturally occurring sugars, some sweet treats can be downright healthy. Sometimes, apples, oranges, and berries even offer nutritional benefits lacking in vegetables.
When asked to identify their favorite fruits, apples (17%), bananas (14%), and strawberries (11%) came out on top. While other options including mangos, watermelons, and pineapples also ranked among the top 10, others received less than 3% of the total vote. Cantaloupe, kiwis, pears, coconuts, apricots, and tangerines were among the least likely to be considered a favorite.
BEVERAGE RIVALS
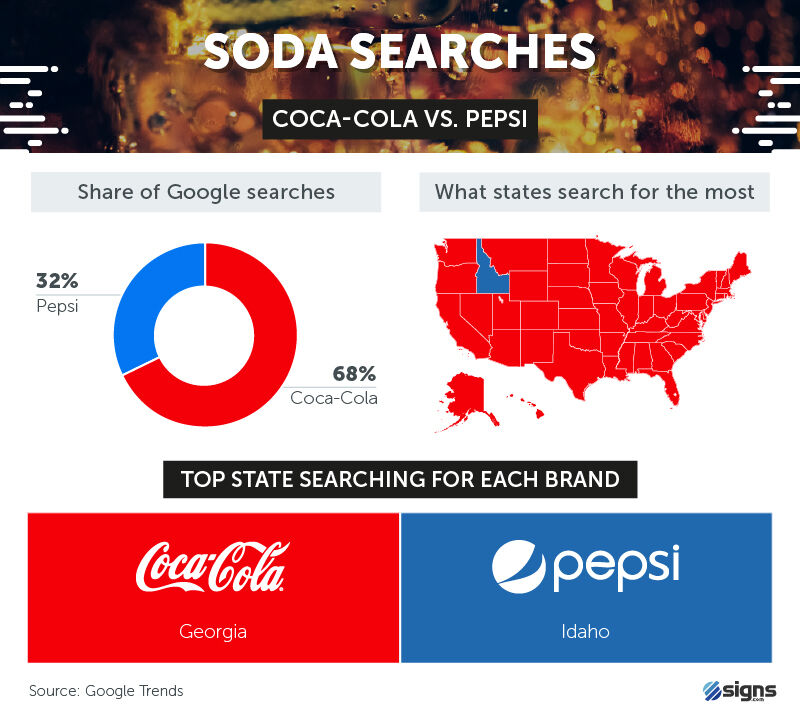
Pepsi may be "OK" according to the advertisements, but Google Trends suggest it might not be the most popular or preferred soda. Compared to 68% of searches for Coke, Pepsi earned just 32%. While most of the country searched for Coke, Idaho was the only state to have more queries for Pepsi.
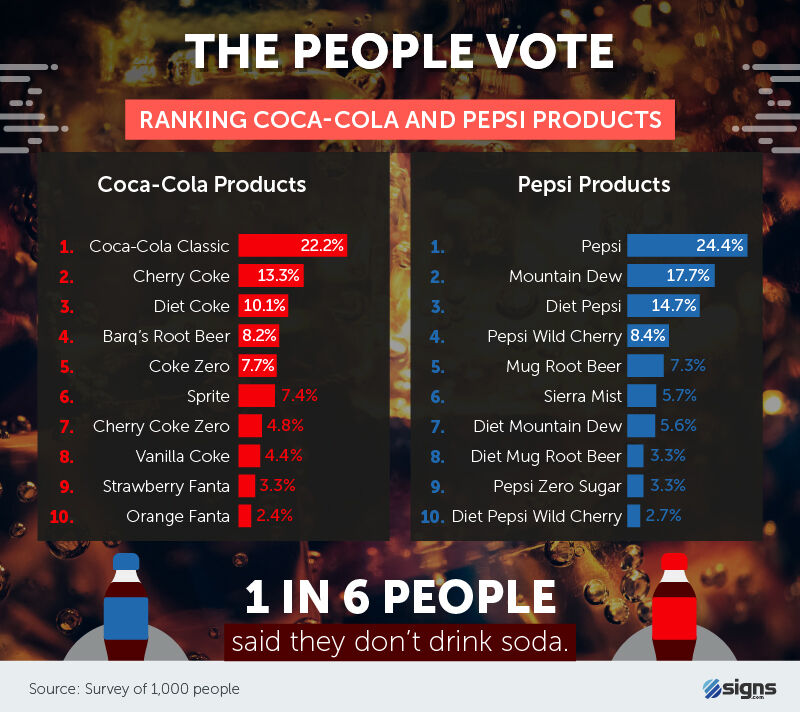
From the classics to diet combinations and add-on flavors, there's almost no shortage of soda selections to pick from.
Still, sometimes there's nothing better than the original. Among Coke products, Coke Classic (22%) was the most popular, followed by Cherry Coke (13%), Diet Coke (10%), and Barq's Root Beer (8%). Pepsi fans had a similar opinion, with classic Pepsi ranking as the most popular (24%), followed by Mountain Dew (18%), Diet Pepsi (15%), and Pepsi Wild Cherry (8%).
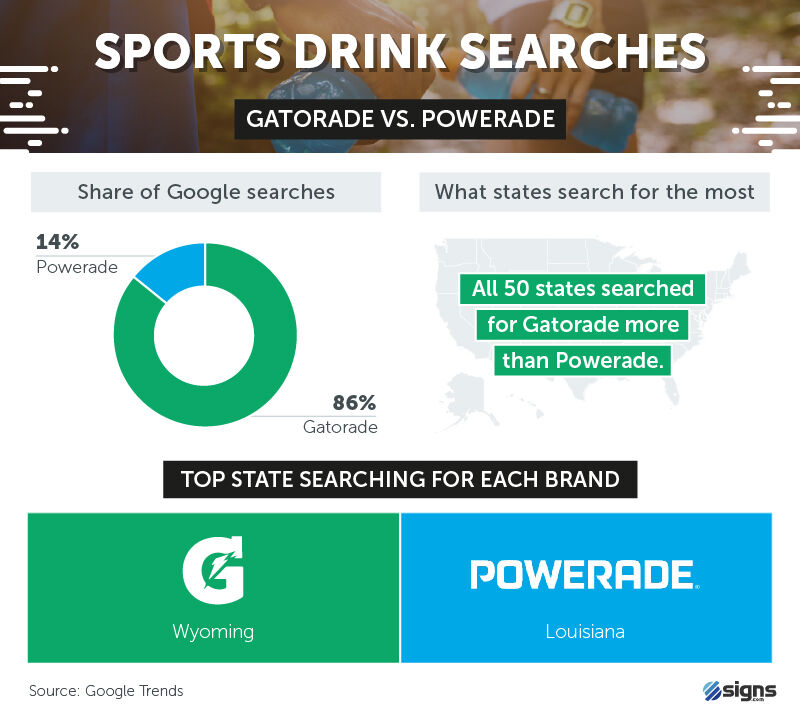
Whether sports drinks are actually good for you remains to be seen, but between two of the most popular brands, Gatorade earned 86% of Google searches, while Powerade pulled in the other 14%. Despite being a product of the University of Florida, Gatorade searches were highest in Wyoming, while Powerade searches were most common in Louisiana.
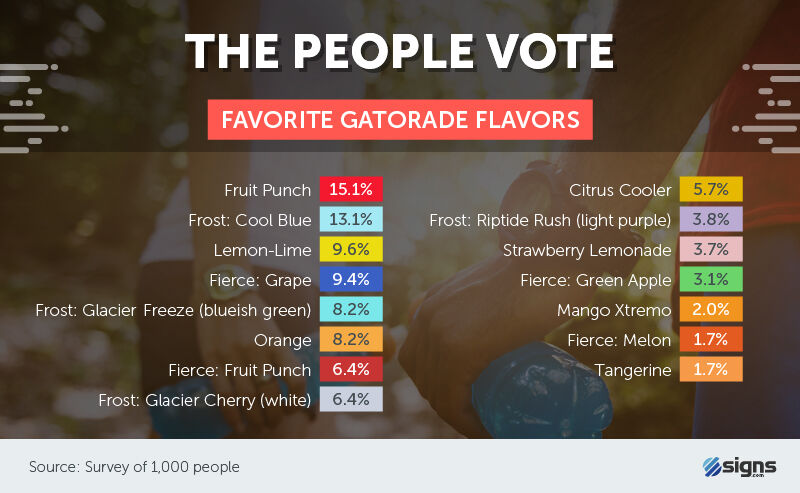
Not all flavors are created equal, and sports drinks are no exception. Flavors like Fierce: Melon and Tangerine may have their audiences, but they were at the very bottom of the list. Respondents actually ranked Fruit Punch, Frost: Cool Blue, and Lemon-Lime as the cream of the crop.
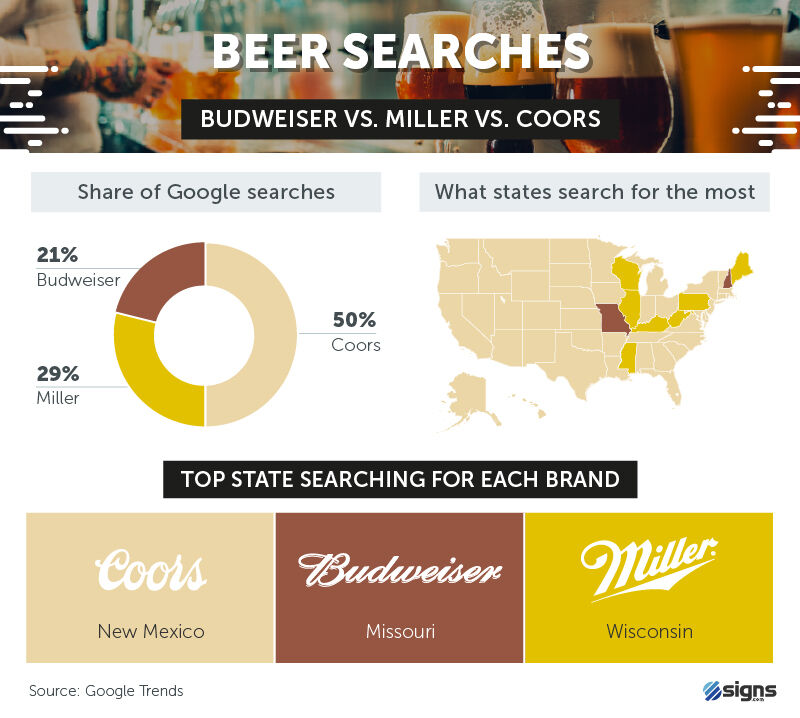
Advertisements during the NFL championship don't come cheap, and one beer brand outdid all the rest with commercial spots in 2019: Budweiser. With ads ranging from 30 to 60 seconds in length, Anheuser-Busch may have spent upwards of $25 million. Budweiser still has some ground to make up in search query, though.
While Coors accounted for half of all beer Google searches, Miller took 29%, and Budweiser earned the other 21%. However, Budweiser and Miller were the top searches in their home states, Missouri and Wisconsin, respectively.
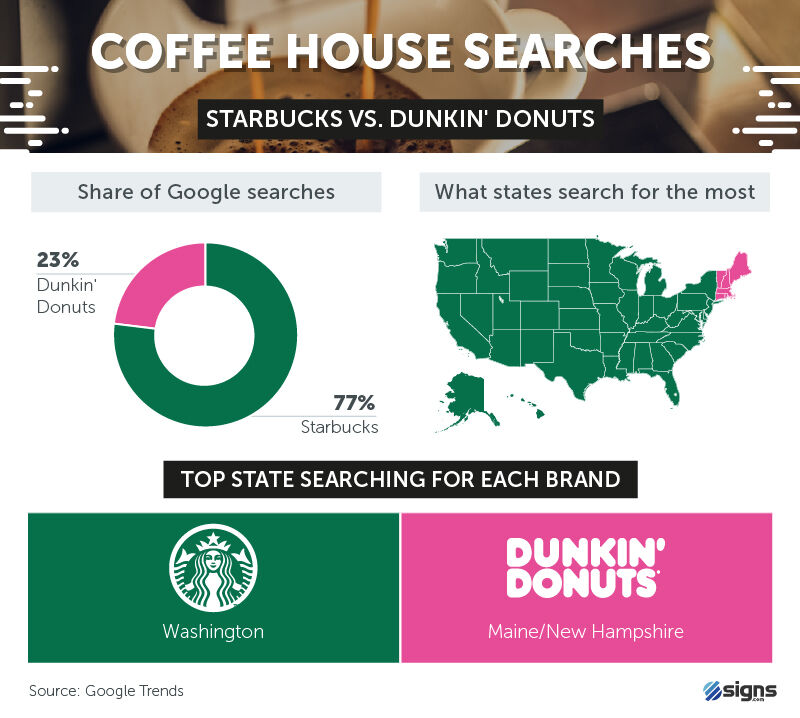
When a nondescript coffee cup accidentally made its way onto the set of the hit HBO show "Game of Thrones," the internet determined it must be from Starbucks. Perhaps unsurprisingly, Starbucks accounted for a majority of searches when compared to Dunkin' Donuts – 77% to 23%.
TECH RIVALRIES
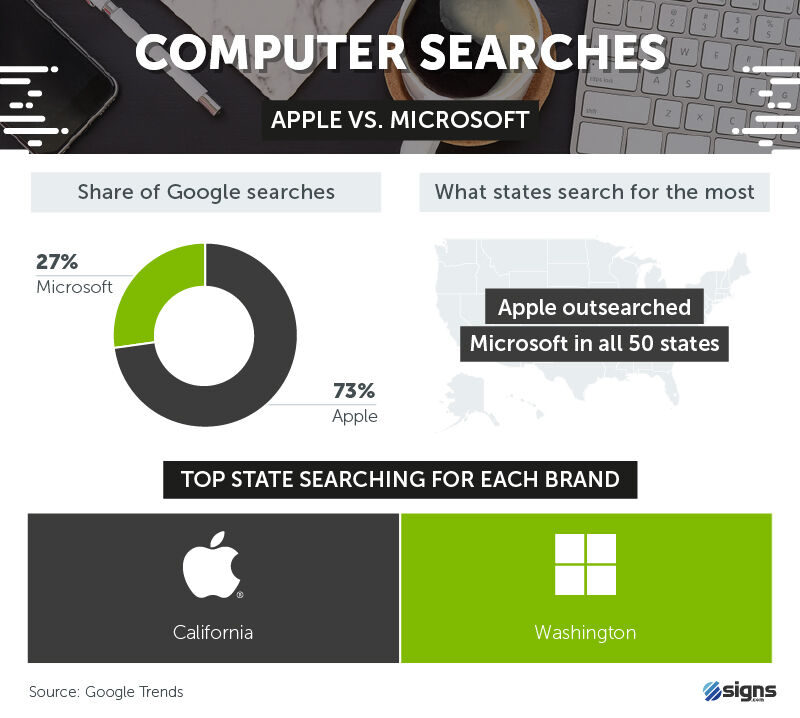
Windows 10 may be four times more popular than Mac computers, but internet interest in Apple may not be phased. While 27% of computer manufacturer searches were for Microsoft, the other 73% were geared toward Apple instead.

No brands command more loyalty among their users than tech and electronics manufacturers. Maybe because switching operating systems is daunting or many users invest in products designed to work together, consumers are typically committed to their brand of smartphones and computers.
If given a free computer, 49% of Mac users still wouldn't switch to a PC. In contrast, 53% of PC customers were willing to take on a Mac for a free computer, and 15% were undecided.
We found a similar trend among smartphone loyalists. With little room left in the market for new competitors, and consumers not buying new phones every year, we asked people how willing they would be to switch brands at no cost.
While 40% of iPhone users would be willing to switch to Android if the phone was free, 51% of Android owners would be willing to take the plunge if they could get an iPhone at no cost.
TRAVEL RIVALRIES
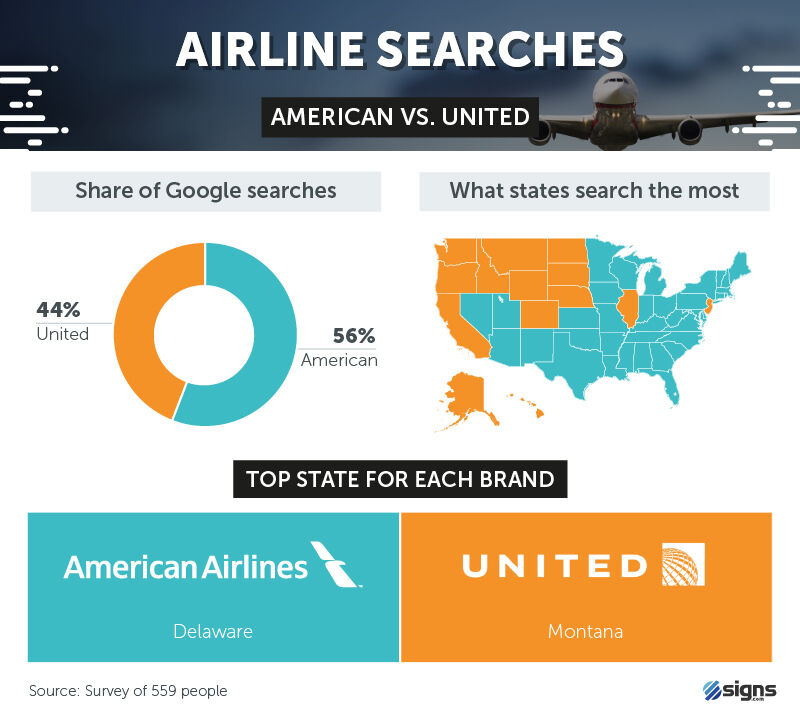
Every day, there are more than 43,000 flights across the U.S. With roughly 5,000 planes in the sky at any given moment and more than 2.6 million passengers flying in and out of U.S. airports, brand loyalty among airlines is big business. Between United and American Airlines, 56% of Google searches were directed toward American and were most common in Delaware.
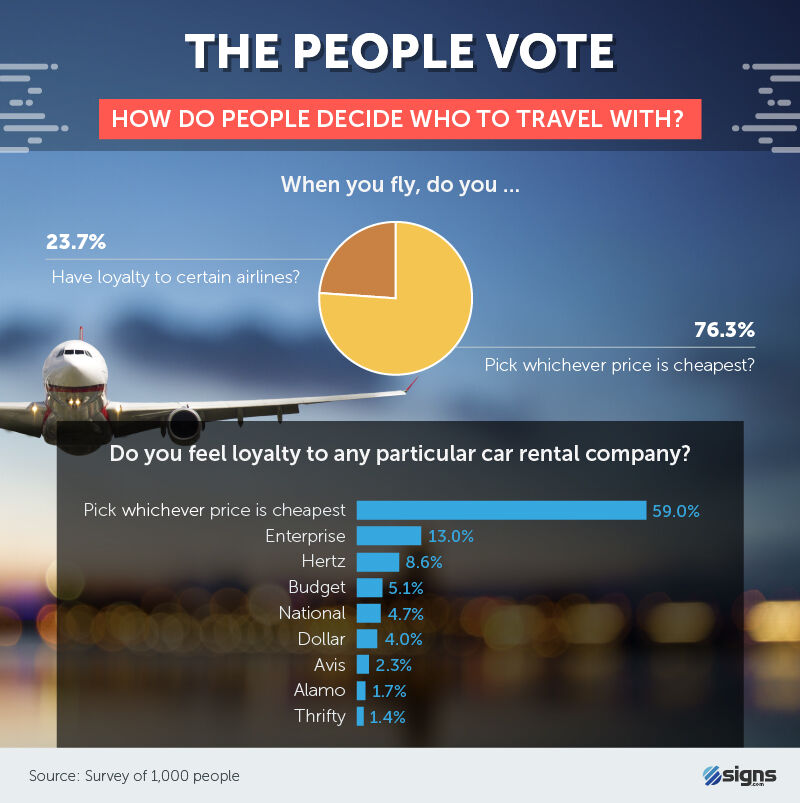 Despite miles, travel
perks, and credit cards designed to keep passengers flying on the same airline, we found
brand loyalty largely didn't extend beyond the cost of the ticket. While 24% of people
had loyalty to a certain airline, 76% opted to fly with whichever carrier was the least
expensive. Another 59% of respondents said the same about rental car companies,
although Enterprise (13%) was the most likely to command consumer loyalty.
Despite miles, travel
perks, and credit cards designed to keep passengers flying on the same airline, we found
brand loyalty largely didn't extend beyond the cost of the ticket. While 24% of people
had loyalty to a certain airline, 76% opted to fly with whichever carrier was the least
expensive. Another 59% of respondents said the same about rental car companies,
although Enterprise (13%) was the most likely to command consumer loyalty.
About Signs.com
Brand visibility may not translate into instant sales for your company, but it's a great place to start. As a business owner, you want to control the optics of your company image and representation, and Signs.com has the resources you need to make an impact. With unique and customizable solutions for all your marketing needs, from banners to acrylic signs, vinyl lettering, vehicle deals, and more, Signs.com will help bring your business vision to life. Take control of the conversation today.
Methodology and Limitations
We compiled the data shown above from two sources: First, Google Trends, which gave us search volume frequency on a state-by-state level. Google Trends had an option to search for not just the word but also rather the topic that relates to the brand we were looking at (for instance, DC the company rather than the disambiguation of "DC," which could mean "District of Columbia"). We limited the trends data to show results from April of 2018 to April of 2019. Using the subject matter we found in our Google Trends results, we then crafted a survey about foods, brands, and other topics related to brands and administered it to 1,000 Americans.
While we made every effort to ensure the data are accurate, Google Trends is based on a sampling of Google searches (not necessarily the entire corpus of searches) and, thus, is variable and subject to change. While it offers the ability to search by subject matter, we recognize it may be imperfect, and sometimes, non-topically related searches for the words may have been categorized as related. The survey results, all under "The People Vote" headings, are obviously opinion and may reflect people's biases or the biases reflective of the sampled population.
Fair Use Statement
Like a great two-topping pizza, this material is best shared. We encourage you to share it wherever you please for noncommercial purposes, asking only that you cite the authors and link back to this page when you do.